Mobile Game Retention Benchmarks Showing What Good D1, D7, and D30 Numbers Look Like by Genre and Platform
Day-one, day-seven and day-thirty numbers from this year’s reports, every one with its source, cut by genre, platform and region. Check your game against them before the UA budget does it for you.
Before any mobile game retention benchmarks, a quick guess. Picture a hundred people downloading some ordinary mobile game over breakfast today. Thirty days on, how many are still tapping the icon? The guesses we hear usually land on five, sometimes ten. It’s less than one. GameAnalytics tracked 16,262 live mobile games through 2025, and for the game sitting in the middle, about 22 of each hundred came back the next day, fewer than 4 a week later and 0.68 to 0.79 after thirty days. Flip that around and the arithmetic gets ugly: a median game buys 125 to 150 installs for every player still around at month’s end. Worth remembering when the CPI invoice lands.
Why was your guess high? Because the number in your head came from someone else’s sample. The same report puts the top 1% of games at 64% to 68% on day one, another widely used dataset puts the average at 27%, and a third puts category leaders above 40%. All three are right about the games they measure. Most bad soft-launch calls we’ve seen started with a team holding its curve against the wrong one.
Here’s the plan. First the data, by percentile, genre, platform and region, with a source and a year on every figure. After that, how to read it without kidding yourself, and the spots where players usually quit. LiveOps, monetization and strategy get one sentence and a link apiece. We kept this page about one thing: where you stand.
What Mobile Game Retention Measures and Why Benchmarks Matter
In plain terms, retention is the share of an install cohort that comes back and opens the game on a given day after install. We’d call it the ceiling on all the other mobile game KPIs a studio tracks. Lifetime value can’t grow past the number of days a player sticks around. And user acquisition (UA) spend only pays back if enough of the people you bought hang on long enough to spend money or watch ads. It’s also the first go/no-go signal a publisher opens at soft launch, usually before anyone asks about revenue.
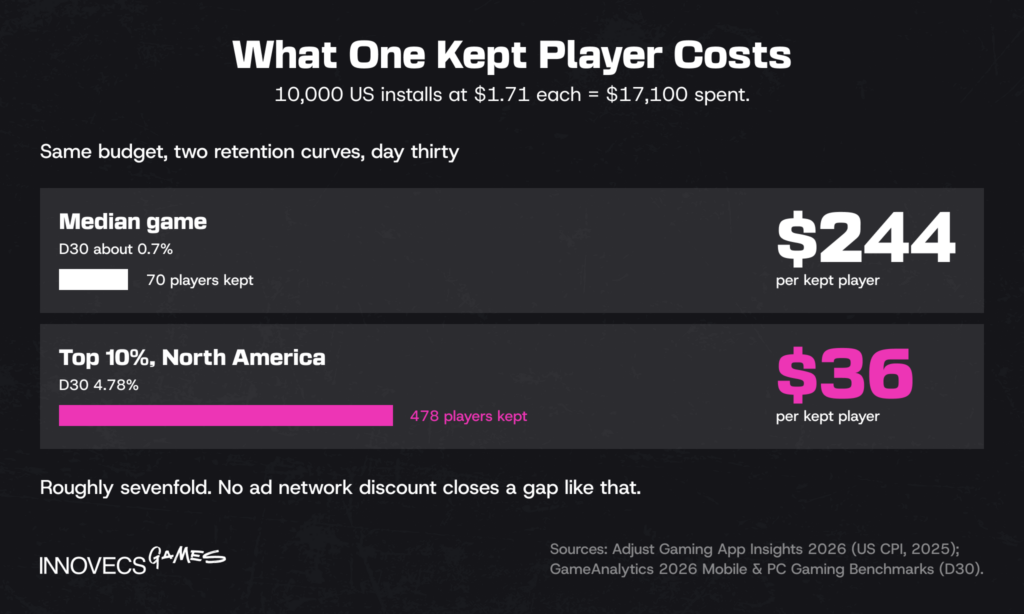
For mobile game retention, the money makes the point faster than the theory. Adjust’s 2026 gaming report puts the average US cost per install for games at $1.71 in 2025, up from $1.31 a year earlier. Buy 10,000 American installs at that price and you’ve spent $17,100. At GameAnalytics’ median day-thirty rate of roughly 0.7%, about 70 of those players are still around a month later, which works out to some $244 for every player you kept. Hold those players at North America’s top-10% rate of 4.78%, and the same spend leaves 478 of them at about $36 each. The sum is rough, since the two datasets don’t share a sample, but the gap is close to sevenfold, and no ad network discount closes a gap like that. Player retention is the cheapest lever on the whole P&L, and our mobile game development services team spends much of its time on exactly the first-week problems described below.
The Retention Formula, With a Worked Example
Day N retention = players from an install cohort who opened the game on day N ÷ players in that cohort × 100. Day zero is the install day.
Say 4,000 players install on Monday, October 5. On Tuesday, 1,040 of them come back, so D1 retention is 26%. A week later, on Monday, October 12, 220 of the original 4,000 open the game: D7 retention of 5.5%. By Wednesday, November 4, only 48 of them play, a day-thirty rate of 1.2%. Every later figure uses the original 4,000 as its denominator, not the players left over from the day before, and that is the most common error we see in spreadsheets built by hand. Churn is the same figure seen from the other side: a 26% day-one rate means 74% of the cohort didn’t come back.
Then come two boring choices that quietly move the result. When does a day start? Midnight UTC, midnight in the player’s time zone, or 24 hours after install all give you slightly different numbers. And what counts as coming back? Some teams count any session at all; we prefer a session that gets past the loading screen, because a crash on launch isn’t a return in any sense that matters. Write both choices down somewhere people will actually find them. Then check that the vendor dashboard and your own warehouse agree, since in our experience they usually don’t on the first try. Of all the mobile game metrics a team argues about, this is the one where the fight is usually over the definition and not the game.
Classic vs. Rolling Retention and D28 vs. D30
Classic retention is the strict version: you count on day seven only if you opened the game on day seven. Rolling retention, which some tools call unbounded, is the generous one. It also counts anybody who turned up on day seven or later, so the number always looks bigger. How much bigger? In the cohort above, 640 players showed up on day seven or later, which makes rolling D7 16% against a classic 5.5%. Neither is wrong. The trouble is that pitch decks quote both and label neither, and when a day-seven number looks suspiciously healthy it’s usually the rolling one (nobody in the room ever asks, in our experience). GameAnalytics uses classic retention, as GameDev Reports pointed out in its write-up of the 2025 edition.
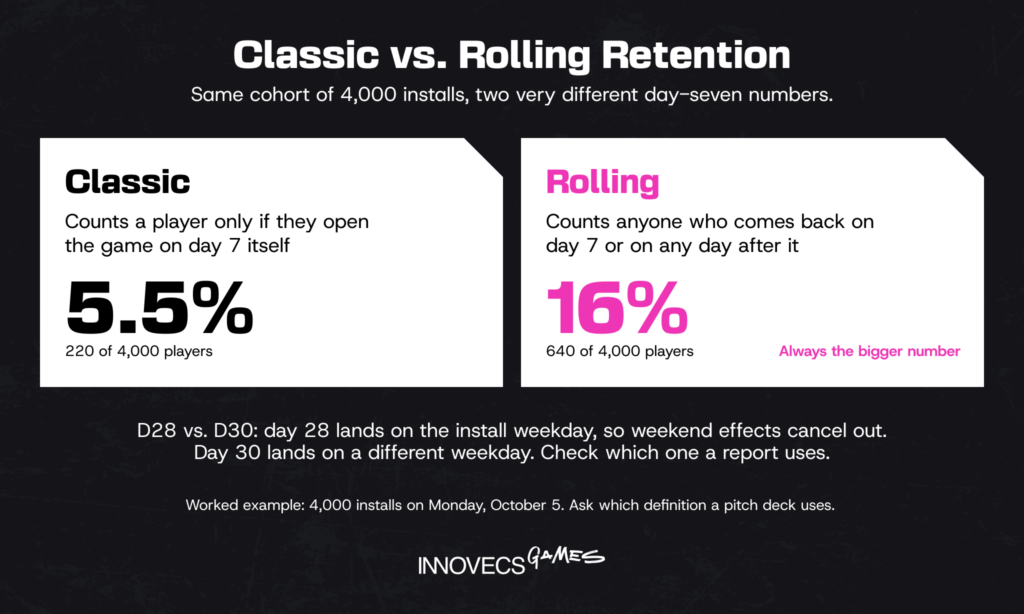
Even the day moves around. The 2025 GameAnalytics edition measured day 28; the 2026 one switched to day 30. There’s a reason people like 28: it’s exactly four weeks, so a Saturday install gets measured on a Saturday and the weekend washes out. Day 30 doesn’t line up that neatly. If your game is big on weekends, the calendar alone can nudge the number. So, before two figures go side by side: same definition? Same day? And is each one a measured median, a vendor’s average or a panel estimate? That’s why every number on this page comes with its source.
Average Retention Rates for Mobile Games in 2026
GameAnalytics has the biggest public dataset this year, and it’s not close: 16,262 live mobile games. Both stores, all genres, all regions. The entry bar was 1,000 monthly active users in 2025. Prototypes and test builds are excluded. Most mobile game retention benchmarks you’ll see quoted this year come from the table below, often without the bottom row or the source.
| Percentile | D1 | D7 | D30 |
|---|---|---|---|
| Bottom 25% (P25) | 12.45% to 13.42% | 1.67% to 1.94% | below 0.5% |
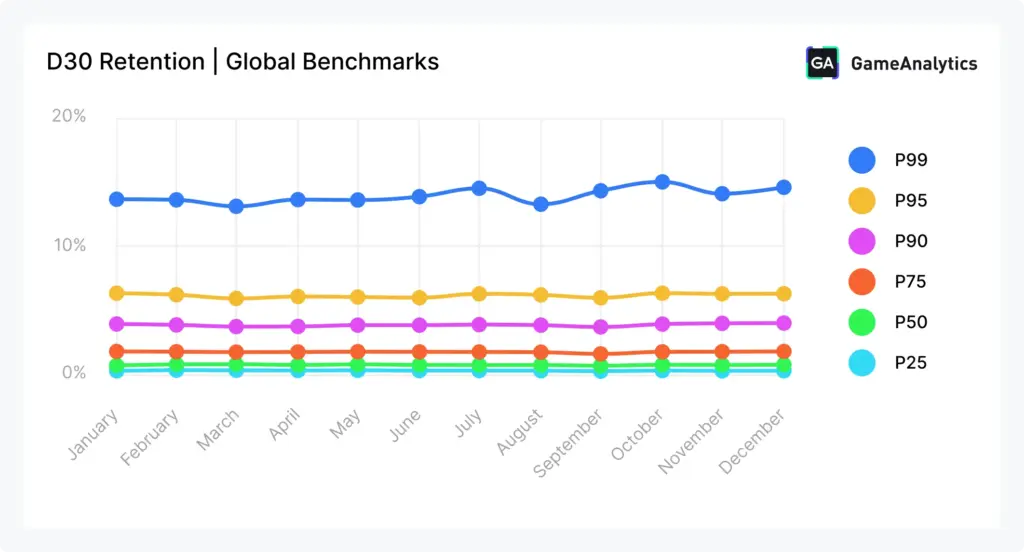
| Median (P50) | ~22% | just under 4% | 0.68% to 0.79% |
| Top 25% (P75) | just above 30% | 6% to 7% | 1.6% to 1.8% |
| Top 10% (P90) | ~40% | 11% to 12% | not given globally (2.5% to 5.1% by region) |
| Top 1% (P99) | 64% to 68% | 25%+ (peaking above 28%) | 13% to 15% |
Numbers from GameAnalytics’ 2026 Mobile & PC Gaming Benchmarks, covering 2025. Where you see a range, the figure moved during the year.
The bottom row is the one that gets quoted on conference stages. Most studios live in the median row. A marketed game wants to be in the top-quartile row before paid acquisition starts making sense.
The best cross-check is Adjust, which tracks apps that pay for attribution, so its sample leans toward marketed titles. Its gaming report puts D1 at 27% across all gaming apps in 2025, flat on the year: above the GameAnalytics median and a little below its top quartile. Adjust’s broader Mobile App Trends 2026 report, as summarized by PPC Land, adds the rest of the gaming curve, with 13% on day seven, 8% on day fourteen and 5% on day thirty. It also offers a rare set of app retention benchmarks for comparison: finance apps held 12% on day one, 6% on day seven and 2% on day thirty. Inside Adjust’s sample, games keep people better than banking apps do. Inside GameAnalytics’ sample, the median game keeps less than 1% for a month. The two don’t contradict each other once you notice they’re counting different games, and the section on why benchmark reports disagree, further down, shows how much that changes the verdict on a single curve.
Median vs. Top-Quartile Games
On day one, the distance between the median and the top quarter is about eight percentage points. Wait until day thirty and the picture changes. The top quarter now keeps more than twice as many players as the median. The top 1%? Somewhere between 16 and 22 players for every one the median has left. Separation happens after the first session, not during it. GameAnalytics also reports that the baseline got worse in 2025: median D1 kept sliding from 2024, and the bottom quarter fell from 13.42% to 12.45% over the year.
If your game sits at the median, we’d spend the next month on day one and day seven and leave day thirty alone for now. Most of the thirty-day gap is just the seven-day gap, compounded. Fixing the early leak is also cheaper, and you find out whether it worked in a week instead of a month.
The 40/20/10 Rule vs. 2026 Reality
There’s a number people love quoting at mobile conferences: 40/20/10. Hit 40% on day one, 20% on day seven and 10% on day thirty, the story goes, and your free-to-play game is healthy. We’ve never found a study behind it. That’s usually how you spot a rule of thumb, so treat it as one.
Against the 2025 numbers, 40% on day one is the top-10% line. Twenty percent on day seven sits between the top 10% and the top 1%. Ten percent on day thirty is close to top-1% territory. A game that hit all three last year would rank among the best few percent of everything GameAnalytics measured. So the rule isn’t wrong, exactly. It got promoted. It used to describe a good game, and now it describes a famous one.
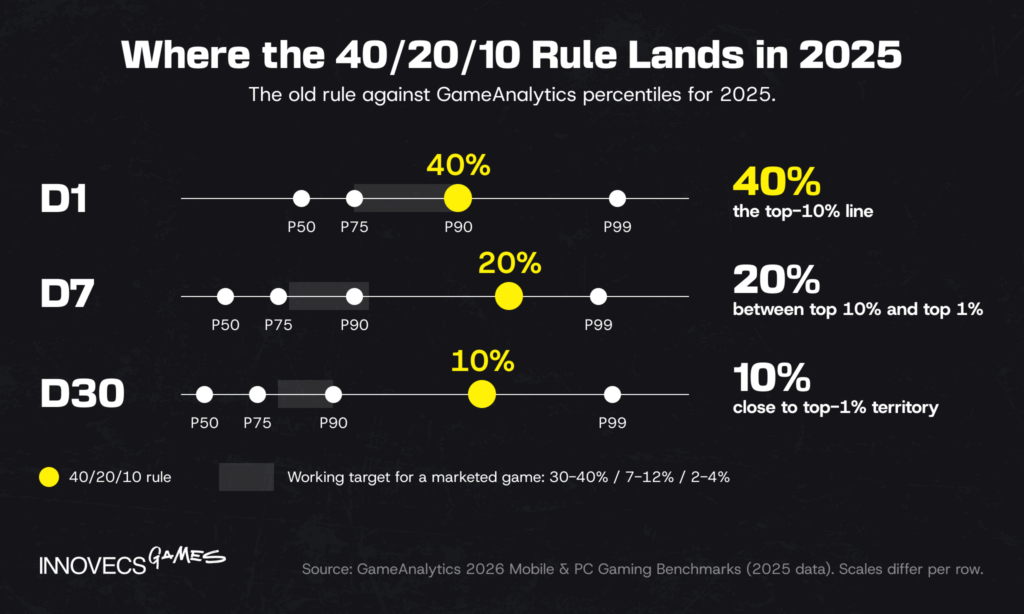
What should you aim for, then? If you’re marketing the game and buying installs, we’d aim between the top quarter and the top tenth, which works out to about 30% to 40% on day one, 7% to 12% on day seven and 2% to 4% by day thirty. It’s a heuristic too (we built it from the percentiles above; nobody publishes it), and genre can drag it a long way up or down.
Beyond Retention: Playtime, Sessions, and Stickiness
Retention tells you whether players come back. Engagement tells you what they do once they’re back. The two tend to move together, too; a game that holds people for twenty minutes a day rarely loses all of them by Thursday. GameAnalytics tracks this side as well, for the same 16,262 games.
| Metric (2025) | Median | Top 25% | Top 10% | Top 1% |
|---|---|---|---|---|
| Daily playtime per player | ~12 min | 22 to 24 min | 40 to 42 min | 94+ min (peaking above 99) |
| Session length | 3.1 to 3.5 min | ~5.2 min | just over 8 min | 22+ min (peaking above 24) |
| Sessions per day | 3.8 to 3.9 | 5.3 to 5.7 | up to ~9.6 | 12+ (peaking above 14) |
Numbers from the same GameAnalytics report, covering 2025.
Look at the median column. Nobody hates that game, as far as we can tell; it just gives people three minutes and nothing to come back for. Games at the top win on session length and on how often people return, both at once. In practice that means one loop that pays off inside a session and another that pays off over several days.
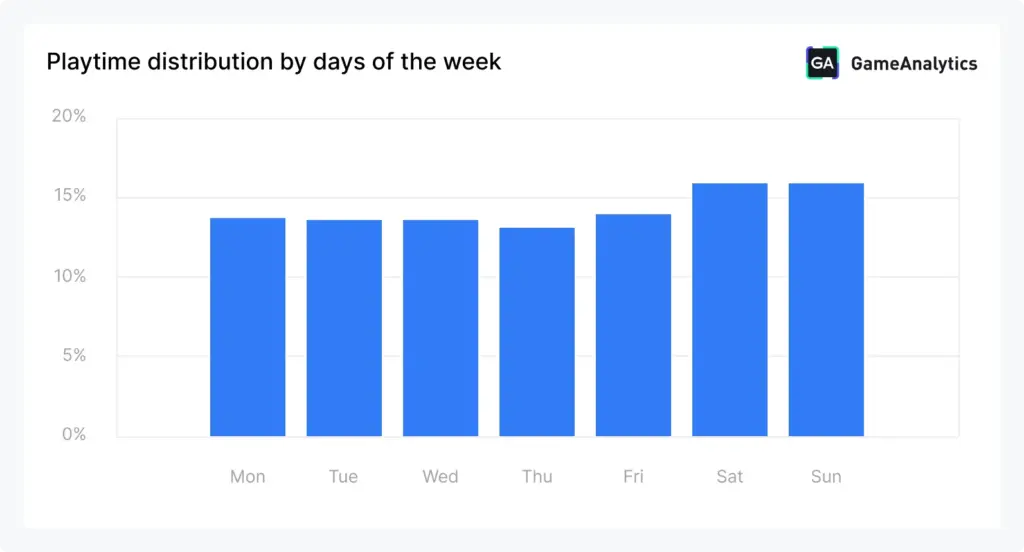
Two more details from the same report are worth having when you plan. First, mobile players don’t care much about weekends. Each weekday gets 13% to 14% of total playtime. Saturday and Sunday? About 15.9% each. A live calendar that saves every event for Friday is leaving most of the week empty. Second, and this surprised us a little, regions differ less than you’d expect. Median daily playtime runs between 11 and 14.5 minutes everywhere (North America highest, South America lowest). The mobile report doesn’t publish DAU/MAU stickiness. If you do track it, think of it this way: the average number of days a monthly player shows up, divided by 30. A 20% ratio is six days a month.
Retention Benchmarks by Genre
Here the data gets thinner, and it’s worth saying so plainly. GameAnalytics’ 2026 edition has no genre split at all. Adjust publishes day-one rates by subgenre for 2025, though only some of them are stated as numbers in its text. Sensor Tower’s State of Mobile 2026 shows the full curve, but only for the top 25 games by revenue in each of four product models. Handy, if you remember you’re looking at category winners rather than an average game. GameAnalytics’ 2025 edition (2024 data) ranks genres by how long they hold players, but leaves the actual figures out of its summary. Where all we have is a direction like that, we say so below and leave the cell empty.
Hypercasual and Hybrid-Casual
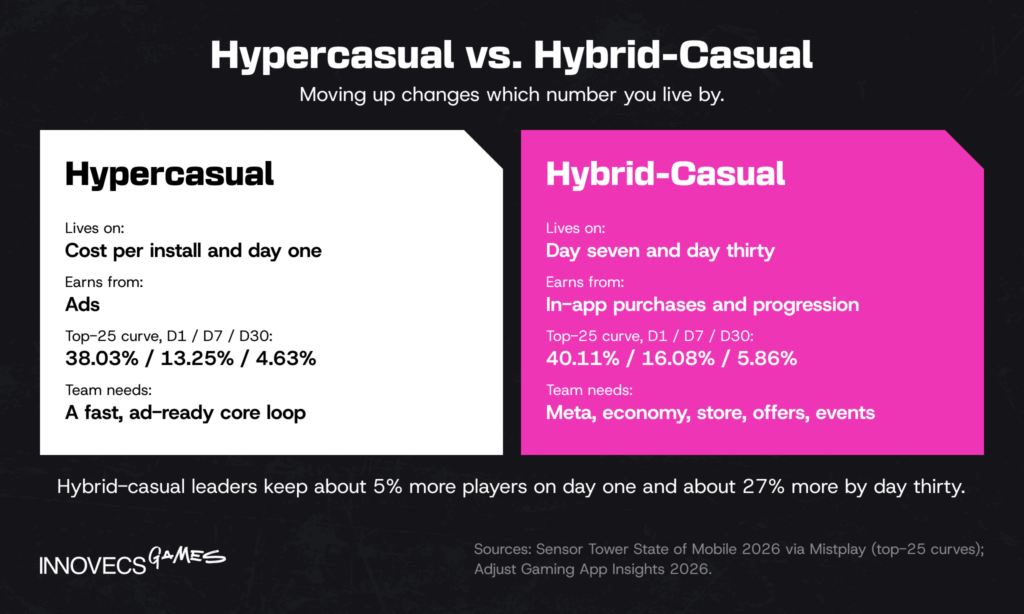
Hypercasual and hybrid-casual tied for the highest day-one rate in Adjust’s 2025 data, both at 27%. The genre also took 29.1% of all gaming installs, and its share of sessions jumped from 11% to 15%, which Adjust links to light progression systems and small in-app purchases creeping into a genre once built on ads alone. Sensor Tower’s top-25 figures, ranked by downloads for hypercasual and by revenue for the others and compiled by Mistplay, show hypercasual leaders at 38.03% on day one, 13.25% on day seven and 4.63% on day thirty, with hybrid-casual leaders ahead at every point: 40.11%, 16.08% and 5.86%. Block Blast and Vita Mahjong were the breakout hypercasual names Sensor Tower singled out for the year, in a segment where time spent rose even in the largest markets. The genre built on disposable installs is learning to keep people, and rising install prices give it every reason to. Our article on hyper-casual games in 2026 goes deeper into that shift.
Moving From Hypercasual to Hybrid-Casual
Plenty of studios are making this move, and the 2025 data shows why. In Sensor Tower’s figures hybrid-casual was the only product model to grow in-app purchase revenue, while hypercasual was the only one to grow downloads. A studio that owns the downloads and wants the revenue ends up here. Adjust shows what staying put costs. Hypercasual’s paid-to-organic ratio went from 3.39 to 4.56 in one year. More of every install is bought now, and the payback window keeps getting shorter.
The switch also changes which number you live by. Hypercasual is about cost per install and day one, more or less. Hybrid-casual has to earn day seven and day thirty, since that’s when purchases and progression start paying. The top-25 curves show it nicely. Hybrid-casual leaders hold about 5% more players than hypercasual leaders on day one, and about 27% more by day thirty. Getting there takes things a hypercasual team never needed: a meta layer, somebody who owns the economy, a store, offers, a small event calendar.
The failure we see most often is a meta bolted onto a loop that was built for ninety seconds of play. Players get a menu full of upgrades and no reason to come back tomorrow. We’d build the progression loop first and the ad-ready core second, and judge early builds on day seven instead of day one.
Casual Puzzle and Match-3
Sensor Tower’s chart for this group is the most uncomfortable one in its report: day-seven retention among the top casual games has declined steadily from early 2022 through late 2025, and hybrid-casual now sits above casual on that measure. Casual leaders still post 31.01% on day one, 15.20% on day seven and 7.48% on day thirty, and the December 2025 average at day seven was 14.9%, according to GameDev Reports’ summary of the report. Century Games’ Tasty Travels stood out at 22%, proof that the slide is a category tendency rather than a law. GameAnalytics’ 2025 edition ranked puzzle among the best genres for medium and long-term retention, alongside board, card and casino. Adjust publishes puzzle’s day-one rate only in a chart, not as a stated figure, so we’ve left it out. If you’re building in this space, our casual game development team works on exactly these curves.
Mid-Core, RPG, and Strategy
Among category leaders, mid-core keeps players best at every point Sensor Tower checks. Its top 25 sit at 41.98% on day one, 20.96% on day seven and 11.45% on day thirty, and they still hold 4% to 5% of players a full year later, per the same summary. There are two catches. Their decay from day seven to day thirty runs almost parallel to casual, so the advantage is mostly built in the first week, and the one-year figure is falling while other models stay flat. Strategy drove 2025, with Last War: Survival and Whiteout Survival leading revenue growth, and Adjust recorded strategy sessions up 57% and average session length rising to 37.5 minutes. Those players are expensive to buy, though: Adjust put the 2025 cost per install at $3.19 for idle RPG and $1.03 for strategy, against $0.56 across all games. Mid-core buys its retention with a steeper bill at the door, and a mid-core game with casual retention is the worst trade in mobile. RPG’s day-one rate appears in Adjust’s chart without a stated figure.
Board, Card, and Casino
These genres have had a few centuries of retention testing; Ludo was around long before Ludo King landed in Adjust’s global top ten by downloads for 2025. GameAnalytics’ 2025 edition placed board, card and casino among the strongest genres for medium and long-term retention, but neither its summary nor the 2026 edition gives a figure for them, and Adjust shows their day-one rates only in charts. There is one recent number, though. AppsFlyer looked at US players across 2023 and 2024 (the report came out with Mistplay in May 2025), and board games kept 8.13% of iOS players and 5.09% of Android players on day thirty. That was the best of any genre in the study; match, puzzle and casino came next. For D1 or D7 in this group, we couldn’t find a sourced figure anywhere. What Adjust does state is a warning sign: casino installs rose 22% and slots installs 46% in 2025, while sessions in both fell 5%. More players arriving and fewer sessions being played is what churn looks like from the outside. Casino also had the highest paid-to-organic install ratio of any genre at 11.05, up 223% on the year. When eleven of every twelve installs are bought, retention stops being a design metric and becomes a finance one.
Action and Arcade
Adjust’s 2025 day-one rates put action at 19% and arcade at 20%, both up a point and both well below the 27% all-games average. Yet GameAnalytics’ 2025 edition named arcade the genre with the strongest day-one retention of any it measured, and one with problems holding players over the long run. The two aren’t measuring the same games: an “arcade” label covers very different products from one taxonomy to the next, and GameAnalytics’ sample includes many small titles that never ran a paid campaign. Action shows a different pattern again. It took 8% of installs but 17.1% of sessions, and its average session of 43.8 minutes was the longest of any genre. Fewer players stay, but the ones who stay really play. Arcade was also the only genre where iOS tracking opt-in fell, from 50% to 46%.
| Genre | D1 | D7 | D30 | Source and year |
|---|---|---|---|---|
| Hypercasual | 27% (all tracked apps); 38.03% (top 25) | 13.25% (top 25) | 4.63% (top 25) | Adjust 2025; Sensor Tower 2025 |
| Hybrid-casual | 27% (all tracked apps); 40.11% (top 25) | 16.08% (top 25) | 5.86% (top 25) | Adjust 2025; Sensor Tower 2025 |
| Casual (incl. puzzle, match-3) | 31.01% (top 25) | 15.20% (top 25); 14.9% Dec 2025 | 7.48% (top 25) | Sensor Tower 2025 |
| Mid-core (incl. RPG, strategy) | 41.98% (top 25) | 20.96% (top 25) | 11.45% (top 25); 4% to 5% at one year | Sensor Tower 2025 |
| Board, card, casino | not published | direction: among the best | board: 8.13% iOS, 5.09% Android (US) | AppsFlyer 2023 to 2024; GameAnalytics 2025 edition (2024 data) |
| Action | 19% | not published | not published | Adjust 2025 |
| Arcade | 20% | direction: weak long-term | direction: weak long-term | Adjust 2025; GameAnalytics 2025 edition |
| Family | 23% (up from 18%) | not published | not published | Adjust 2025 |
About the top-25 rows: they come from Sensor Tower’s State of Mobile 2026 (top 25 games by 2025 IAP revenue in each product model, or by downloads for hypercasual), as compiled by Mistplay.
Treat those top-25 rows as a ceiling. They’re not a target. They describe games that already won their category, and a soft-launch build compared against them will look broken even when it’s healthy.
None of the sources above answers the question in this article’s title directly, so here is our answer, put together from all of them. Each band describes a marketed game in soft launch or early live operation that is doing well for its genre: above the market median, below the category leaders.
| Genre | Good D1 | Good D7 | Good D30 | Built from |
|---|---|---|---|---|
| Hypercasual | 30% to 38% | 6% to 10% | 1% to 3% | Adjust D1 average (27%), Sensor Tower top-25 curve |
| Hybrid-casual | 32% to 40% | 9% to 14% | 2.5% to 5% | Adjust D1 average, Sensor Tower top-25 curve |
| Casual puzzle and match-3 | 27% to 32% | 8% to 14% | 3% to 6% | Sensor Tower top-25 curve, GameAnalytics direction |
| Mid-core, RPG, strategy | 32% to 40% | 10% to 18% | 4% to 9% | Sensor Tower top-25 curve, GameAnalytics percentiles |
| Board, card, casino | 28% to 35% | 8% to 12% | 4% to 8% | AppsFlyer US D30, GameAnalytics direction |
| Action and arcade | 24% to 30% | 5% to 8% | 1% to 2.5% | Adjust D1 averages (19% to 20%), GameAnalytics direction |
| All genres, marketed title | 30% to 40% | 7% to 12% | 2% to 4% | GameAnalytics 2026 top-quartile to top-10% range |
Source: Innovecs Games estimate, pieced together from GameAnalytics (2026 and 2025 editions), Adjust Gaming App Insights 2026, Sensor Tower State of Mobile 2026 via Mistplay, and AppsFlyer’s US data for 2023 to 2024. It’s our working heuristic. Nobody publishes this table, and where a source only gives a direction we started from the all-genre range and nudged it up or down.
Platform moves every row. On iOS, aim for the top of each band; on Android, the bottom of it is a healthy result, since day one runs about six points lower in the 2024 data and day thirty, in the one genre with a split, about a third lower.
iOS vs. Android: How Platform Shifts the Curve
Neither of the 2026 reports we lean on splits retention by platform, so the clearest public figure is a year older. GameAnalytics’ 2025 edition, built on 2024 data, put top-quartile D1 retention at 31% to 33% on iOS against 25% to 27% on Android, a gap of about six points. The same report found Android players starting more sessions per day than iOS players, the opposite of the retention result. Android players open the game more; iOS players are more likely to come back at all. Run one blended benchmark across both stores and you’ll read a normal Android number as a broken one.
Later days are harder to find split by platform, and the clearest recent figure is a narrow one. In the AppsFlyer data on US players for 2023 and 2024, board games held 8.13% of iOS players on day thirty against 5.09% on Android. That’s three points on a base of about five, so iOS kept roughly 60% more players, a far wider relative gap than six points out of roughly thirty on day one. One genre in one country is thin evidence, but it suggests the platform gap grows over the month rather than staying fixed at the day-one figure.
Why iOS Usually Retains Better
Audience is the first reason. Apple’s share of phones is highest in wealthier markets such as the US and Japan, and players there tend to have more disposable income for the games that keep them, so iOS cohorts lean toward the audience that stays. Device range is the second. An App Store build runs on a short list of Apple models, while a game on Google Play meets thousands, including phones with little memory where loading stalls or the app is killed in the background, and a player whose first session crashes doesn’t come back to find out whether it gets better.
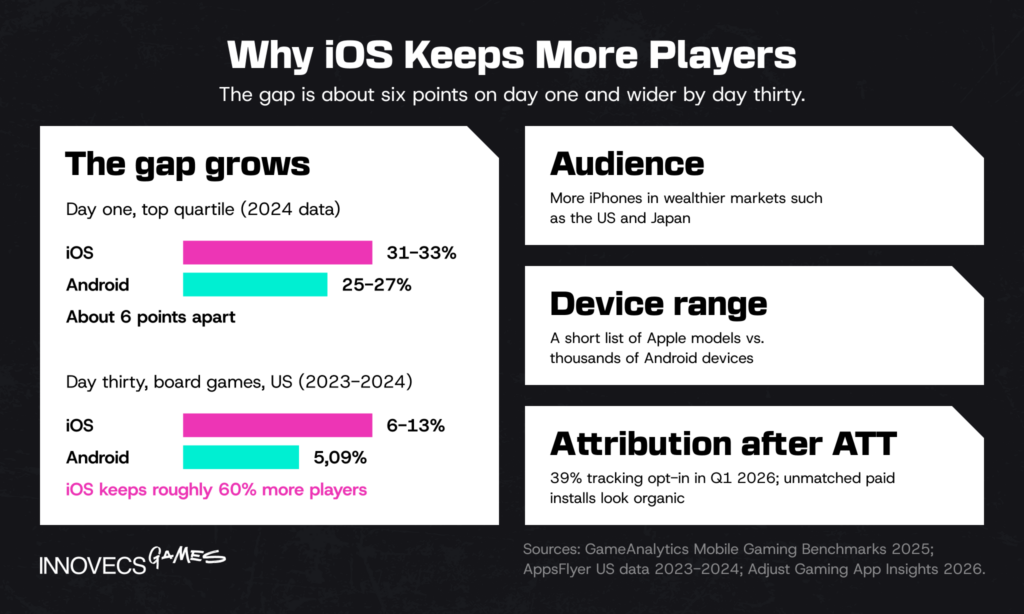
Then there’s ATT, the least obvious of the three. Adjust’s numbers here are blunt. In Q1 2026 only 39% of iOS users who saw Apple’s tracking prompt tapped yes, and in North America just 33% did. Installs that no campaign can claim then tend to land in the organic bucket, which makes any channel split on iOS fuzzier than it looks. The overall curve is fine. The paid-versus-organic split underneath it is partly guesswork, and we’d say so out loud in any review.
When Android Closes the Gap
When does Android catch up? Mostly when its players start to look like iOS players. In markets where lots of people carry recent high-end Android phones, the device problem more or less goes away. Same for games light enough to run on modest hardware. We haven’t found a public dataset that checks this country by country, so take it as reasoning, not a benchmark. Every so often it even flips, and when it does, the iOS build is usually the broken one: a purchase flow that fails, say, or a fix stuck in review.
Something we’ve learned on our own projects: when Android D1 sits well over six points below iOS (the 2024 gap), go look at crash rates, load times and device-tier performance first. Leave the tutorial alone for now. In our experience a gap that big is usually technical, not creative. Our game testing guide has more on catching that kind of problem before players do.
If You Also Ship on PC
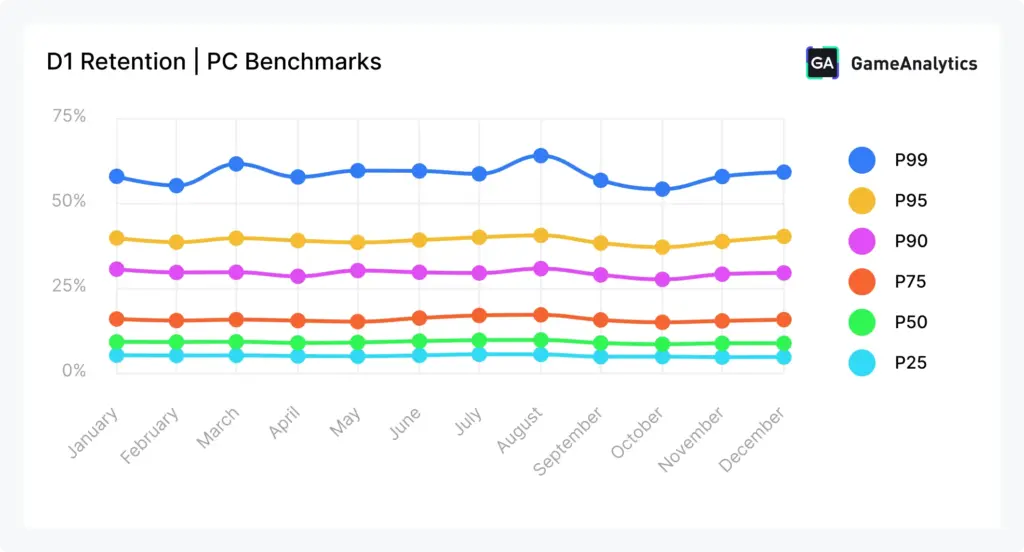
If you’re bringing a mobile title to PC, or running both, don’t hold PC retention to the mobile table. GameAnalytics’ 2026 PC benchmarks cover 3,582 games, each with at least 100 monthly active users and four months of data in 2025. The median PC game kept roughly 7% to 9% of players on day one (the report gives both numbers, on different pages, which is mildly annoying), 1.7% to 1.8% on day seven and about 0.2% to 0.3% on day thirty. At the top it looks very different. The best quarter hit 15% to 16% on day one, and the top 1% reached 50% to 60%, not far off the mobile elite.
Where PC looks weak on retention, it looks strong on depth. The median PC player put in 32 to 33 minutes a day, across 1.65 to 1.70 sessions of about 18 minutes each. On mobile it’s roughly 12 minutes a day, and PC’s median DAU/MAU sits at only 4% to 5%. PC players, in short, come back less often and stay far longer when they do. Judge a port on playtime and session length before you look at day-based retention. We’ve seen good ports written off because someone expected a phone-style daily habit from a PC audience.
Retention by Region: Where Geography Moves the Numbers
The iOS argument above was partly an argument about wealth, and the regional numbers carry the same fingerprint. GameAnalytics’ 2026 regional data shows medians sitting fairly close together on day one and spreading out as the month goes on. Oceania, North America and Europe hold the strongest day-thirty medians at 1.39%, 1.18% and 0.92%. Asia’s median drops hardest, to 2.68% on day seven and 0.53% on day thirty, though its top 1% still reaches 10.05% on day thirty. Distance from the median is a market effect; distance from the top is a game effect. Newer data points the same way for fast-growing markets: Mintegral’s India Gaming Growth Outlook 2026, built on January to April 2026 data, found three quarters of the mobile games it analyzed in India below 3% on day thirty.
| Region | Median D1 | Median D7 | Median D30 | Top 10% D30 | Adjust D1, 2025 |
|---|---|---|---|---|---|
| North America | 23.28% | 4.97% | 1.18% | 4.78% | 19% |
| Europe | 22.20% | 4.06% | 0.92% | 4.05% | 21% |
| Oceania | 25.63% | 5.60% | 1.39% | 5.07% | not reported |
| Middle East | 21.90% | 3.74% | 0.79% | 3.08% | 20% (MENA) |
| Africa | 18.52% | 5.60% | 0.71% | 2.53% | not reported |
| Asia | 17.50% | 2.68% | 0.53% | 2.59% | 20% (APAC) |
| Central America | 21.37% | 3.71% | 0.78% | 2.85% | 20% (LATAM) |
| South America | 20.09% | 3.25% | 0.65% | 2.54% | 20% (LATAM) |
Sources: GameAnalytics 2026 (yearly averages of weekly data, 2025); Adjust Gaming App Insights 2026 (2025). Adjust’s regions don’t map one to one onto GameAnalytics’.
North America is the row to stare at. It ranks second for median D1 in GameAnalytics’ data and last in Adjust’s, at 19%. Adjust’s North American cohorts are heavily bought, with 3.52 paid installs for every organic one in 2025 and an average cost per install of $1.68, and a studio buying that deep into an audience reaches players who were never likely to stay. Its regional figures, all between 19% and 21%, also sit below its 27% global average, and the report draws on two different country sets, so its global and regional numbers shouldn’t be mixed. Japan had the highest day-one rate of any country Adjust tracks, at 25%.
If you’re planning a soft launch, this is the bit to remember. Judge a test market against its own regional row and not the global median. Otherwise the Philippines will look like a disaster and Canada like a hit, and both may simply be showing you geography.
How to Use These Benchmarks Without Misreading Them
By now you’ve seen half a dozen datasets that disagree on nearly every number. Don’t worry, that’s normal here and doesn’t mean the research is bad. Which source is right? Wrong question. Ask which one describes a game like yours. Five quick checks will tell you, and it’s worth running them before you set any target:
- Population. Is it every live game with 1,000+ MAU, marketed apps that pay for attribution, or the top 25 in a category?
- Definition. Classic or rolling? Day 28 or day 30? And when does your “day” start?
- Platform mix. A blended curve on a 70/30 Android split can’t be compared with one on 30/70.
- Channel mix. The more installs you buy, the closer you’ll sit to Adjust’s paid-heavy cohorts, and the further from the overall median.
- Payers. In an in-app purchase game a handful of spenders carries most of the revenue, so give their curve its own line on the dashboard. The all-player curve can look perfectly steady while the people paying for the game slip away.
Why Benchmark Reports Disagree
Population, the first of those, explains most of the spread on its own. None of the sources is wrong, which is honestly the annoying part.
| Source | What it samples | How it’s measured | 2025 D1 | Best used for |
|---|---|---|---|---|
| GameAnalytics 2026 | 16,262 live mobile games with 1,000+ MAU | Classic retention, percentiles | ~22% median | Locating your game within the whole market |
| Adjust 2026 | Apps tracked by Adjust, top 5,000 plus full dataset | Averages from attributed installs | 27% average | Marketed games running paid UA |
| Sensor Tower 2026 | Top 25 games by revenue per product model | Panel-based estimates | 31% to 42% by model | What category leaders look like |
| GameAnalytics 2025 | 11,600 games, 2024 data | Classic, day 28 instead of day 30 | 26% to 28% top quartile | Platform split and genre direction |
Who can each of them actually see? GameAnalytics is an SDK, so it sees every small game that installed it, plenty of which never spent a dollar on ads. Adjust is an attribution vendor and mostly sees games with a marketing budget. Sensor Tower models the charts from a panel. All three are honest about their slice. The catch is that your game will look better or worse depending on which slice you happen to hold it against.
Why Retention Got Harder to Measure
Your own cohort curve is the most reliable number you’ve got, since it counts every player who opens the build. Splitting it by campaign is where we start to get nervous. On iOS most people say no to tracking (the opt-in figures are back in the platform section). Attribution partners then fill the gap with whatever they have: device matches where they exist, Apple’s aggregated postbacks, and their own modeling for the rest. And the postbacks arrive grouped and late. Honestly, an iOS channel report is less a measurement than a well-informed rumor. In 2024 AdExchanger reported that Apple was folding SKAdNetwork into a new framework, AdAttributionKit. The part that matters for retention came with iOS 18: a lapsed player who returns through an ad can now be credited to that ad. Some of what looks like a loyal returning cohort may, in other words, have been bought.
From Retention to LTV and UA Payback
This is where benchmarks turn into money, and the mechanism is the area under the retention curve. Add up the share of the cohort that plays on each day after install, and you get the number of active days one install produces. Multiply by daily revenue and that’s lifetime value. The table below works out that area over 90 days for four curves. Then it asks the question a publisher actually cares about: how much does each active player-day have to earn before one install pays for itself?
| Curve (D1 / D7 / D30) | Active days per install, days 0 to 90 | ARPDAU to repay a $0.56 install | ARPDAU to repay a $1.71 install |
|---|---|---|---|
| Median (22% / 3.8% / 0.74%) | 2.2 | $0.25 | $0.77 |
| Top 25% (31% / 6.5% / 1.7%) | 3.2 | $0.17 | $0.53 |
| Top 10% (40% / 11.5% / 4.5%) | 5.7 | $0.10 | $0.30 |
| Mid-core top 25 (42% / 21% / 11.5%) | 11.5 | $0.05 | $0.15 |
Source: Innovecs Games estimate. Curves from GameAnalytics 2026 percentiles and Sensor Tower’s mid-core top 25; $0.56 is Adjust’s 2025 average gaming CPI, $1.71 its US average. Top-10% day thirty uses the North America and Europe range, since GameAnalytics doesn’t publish a global figure. We drew each curve by interpolating log-linearly between D1, D7 and D30, then kept the D7-to-D30 slope going past day 30.
Those rows explain a lot of studio behavior. On a median curve, every active player has to bring in well over 70 cents a day to repay an American install, and almost no casual game earns that. On a top-tenth curve it’s about 30 cents. Genre sets the price on the other side. Adjust’s 2025 install costs were $1.03 for strategy, $3.19 for idle RPG and $4.47 for slots. Even a mid-core game with a top-25 curve, then, needs around 28 cents a day to pay back an idle RPG install inside 90 days. So retention isn’t just extra revenue. It decides which channels and countries you can afford to buy in the first place, which is why we’d happily spend an extra week arguing about day seven in a design review rather than an extra month arguing about bids in a UA meeting. Only one of those meetings can change the curve.
Two traps hide behind the numbers. The first is early ROAS. A game that monetizes fast and churns fast can look brilliant on day-seven return on ad spend, which only tells you the first week paid. Meanwhile a slow-burn strategy game can look weak on day seven and pay back twice over by day 180. So set the payback window from your genre’s curve before you judge a campaign on it. The second trap is the category. Sensor Tower’s US data for 2025 is pretty stark here. Lifestyle and puzzle games took 56.2% of gaming ad spend and earned only 41.3% of in-app revenue. Casino did the opposite, with 10.4% of spend and 21.6% of revenue, while action and strategy stayed close to balance (30.7% and 34.8%). In a crowded category you pay more for every install before retention has even had a chance.
Want to run the same sums on your own numbers?
Download the retention benchmark checker, enter D1, D7 and D30 by platform, and it’ll show your percentile band, which stage threshold you’re above or below, and the ARPDAU you need to pay back your cost per install.
Realistic Targets by Development Stage
Retention means different things at different stages. The most expensive mistake we see is judging a build on a number its stage can’t produce yet. The table below is our working heuristic, anchored to the GameAnalytics 2026 percentiles; nobody publishes this as a benchmark.
| Stage | What to measure | Signal to keep going (heuristic) |
|---|---|---|
| Prototype and playtests | FTUE completion, session-one length, where testers stop | Most testers finish the first session without help |
| Technical soft launch | D1 by platform and device tier, crash and load data | D1 near the platform’s top quartile (iOS ~31% to 33%, Android ~25% to 27%, 2024 data) |
| Soft launch, retention phase | D7 across successive builds | D7 at 6% to 7% or better, trending up build over build |
| Soft launch, scale test | D30 by channel and country | D30 above ~1.7% to continue; ~4% or more (top 10% in North America and Europe) to scale UA with confidence |
| Global launch | Cohort curves by channel, platform, country | Curves hold their shape as paid volume grows |
Source: Innovecs Games delivery data from 2023 to 2026 projects. We pegged the thresholds to the GameAnalytics 2026 percentiles. Expect genre to shift every row. Mid-core targets sit well above these, and hypercasual day-thirty targets sit below.
A soft launch has to run long enough to measure the row it’s testing. Supercell, better known than most studios for killing its own games, kept Clash Mini in soft launch for more than two years before ending it in 2024. Squad Busters went the other way. It skipped the usual long beta, launched globally in May 2024, went through several reworks and is now being shut down, and the studio later admitted it hadn’t been ready. A few weeks of soft launch tell you about day one. Day thirty is another matter: you need at least a month per cohort, plus time to change the build and measure again.
Where Players Usually Drop Off
A number below the stage threshold says players left. The day they left says who has to fix it.
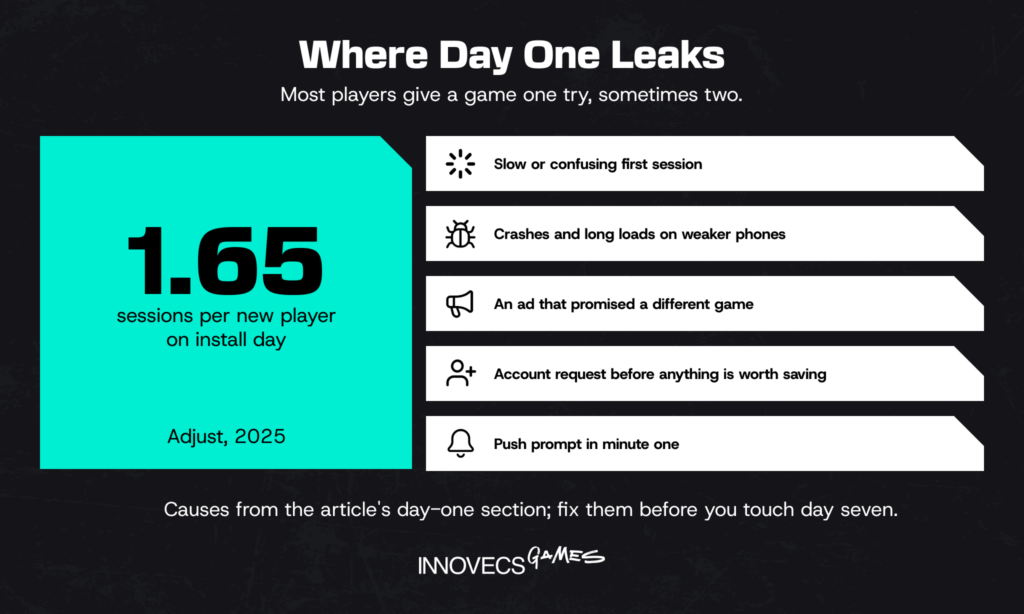
Day one. This is where most players go, and most of them go during the first session. Adjust counted 1.65 sessions per new player on install day in 2025; in other words, people give a game one try, two if you’re lucky. The usual suspects are a slow or confusing first-time user experience, crashes and long loads on weaker phones, and an ad that promised a different game. Don’t underestimate that last one. Someone who installed for the puzzle in the ad and lands in a twenty-minute story intro feels conned, and they’re not wrong. Two smaller habits hurt quietly as well. One is asking for an account before the player has done anything worth saving. The other is the push-permission prompt in minute one, before there’s anything to be reminded about. Our guide to mobile game design covers FTUE and onboarding in detail.
Day seven. Players who make it through day one tend to drift off during the first week, once the core loop stops surprising them. Our D7 retention checklist is short. Does the player have a goal beyond the tutorial by day two or three? Is difficulty climbing faster than their skill? And does coming back tomorrow earn them anything today’s session didn’t? A weak D7 sitting next to a healthy D1 nearly always means the loop, not the onboarding.
Day thirty. By the end of the month you’re competing on content depth, meta progression and social ties, meaning guilds, friends and some reason to turn up for the weekend event. Sensor Tower saw 2025 live ops drift in exactly that direction, with more milestone events, tournaments and club play and fewer plain offers. Give lapsed players who come back a line of their own. They play differently from new installs, and since iOS 18 some of them were bought back by an ad anyway (see the measurement section above). Keeping that supply going is a LiveOps job, covered properly in our article on LiveOps strategy for games. How you charge players also shapes who sticks around; our mobile game monetization article deals with that side.
After every update. One release can shift any of the three numbers overnight, so compare cohorts by build version as well as by install date. Store ratings and review text usually react within days of a bad build, often before the day-seven cohort has even matured. Free early warning, basically.
Look at where the drop shows up, and where it doesn’t. That usually tells you whose desk it lands on:
| What the data shows | Most likely cause | Usually owned by |
|---|---|---|
| Day one weak across every channel and creative | First session: onboarding, loading, crashes | Product, engineering |
| Day one weak only for certain creatives | The ad promises a different game | UA, creative |
| One platform or device tier far behind the rest | Performance or stability on that hardware | Engineering, QA |
| Day seven weak everywhere, day one healthy | Core loop or early progression | Game design |
| Day seven weak only in some channels | Traffic quality, such as incentivized or broad targeting | UA |
| Day thirty weak regardless of source | Content depth, meta, social systems, events | LiveOps, design |
| Curve drops right after a release | Build regression or an economy change | Engineering, QA, economy design |
This table saves more meetings than you’d think. Most retention arguments we sit in are two teams each proving the problem lives in the other team’s area, and splitting the data by channel and build usually settles it in one slide.
Ad Creatives, Channels, and the Players They Bring
Day one is partly decided before the install even happens. The ad sets an expectation, and the first session either meets it or it doesn’t. According to Sensor Tower, 2025 creatives got more interactive and more crowded at the same time. Playables nearly doubled their share of gaming ad impressions, to 13.3%. Rewarded placements rose to 17.7%. Puzzle alone took about 30% of global gaming ad exposure, so creatives in busy categories burn out faster. Adjust adds that studios now use generative AI to test far more creative variants than they used to.
With that many variants, one habit becomes non-negotiable: cut day one and day seven by creative and ad set, not just by channel. The most expensive asset in any account is a creative with a great install rate and a weak day one, since it’s buying players for a game you didn’t make. Playables help when they show the real core loop, because the player has already tried what they’re getting. Our view is blunt. The first minute of the game should look like the ad that sold it, and if the team can’t make that true, change the ad.
What to Watch Depending on Your Role
The same benchmark answers different questions depending on who’s asking:
- Head of Production or Executive Producer: Has the build earned the next stage? (The stage table answers that.) And is the soft launch long enough to measure day thirty at all?
- Publishing Director or LiveOps Lead: How steep is the drop from day seven to day thirty? Did that event spike bring lapsed players back, or just keep the regulars busy? And what do the payers’ curves look like next to everyone else’s?
- UA and marketing: Day one and day seven per creative and per channel, held against the organic baseline. Payback windows come from the genre, not from whatever was used last year.
- CTO or Technical Director: The gap between platforms and device tiers, crash and load data per build, and one awkward question. Can our event tracking explain a drop, or only show it?
Below Benchmark? Let’s Find Out Why
Send us a build. Our mobile team will play the first session, read your cohort curves by platform and channel against the numbers above, and tell you what we’d change first and what we’d leave alone. Most of these reviews end with fewer changes than teams expect.
How AI Is Changing Retention Analysis
Churn prediction isn’t new. What’s changed is how early the prediction shows up, and who can run it. Back in 2016, a study of 130,000 Jelly Splash players (Wooga’s puzzle game) found that a single session told you almost nothing, the first day helped a bit, and a full week of play pushed accuracy to about 79%. A 2022 paper on a one-versus-one mobile game went further. There, first-day behavior was enough to predict churn quite accurately, and adding data on players’ social connections made the model better still. Today, mobile game retention prediction is less a research question than a plumbing one.
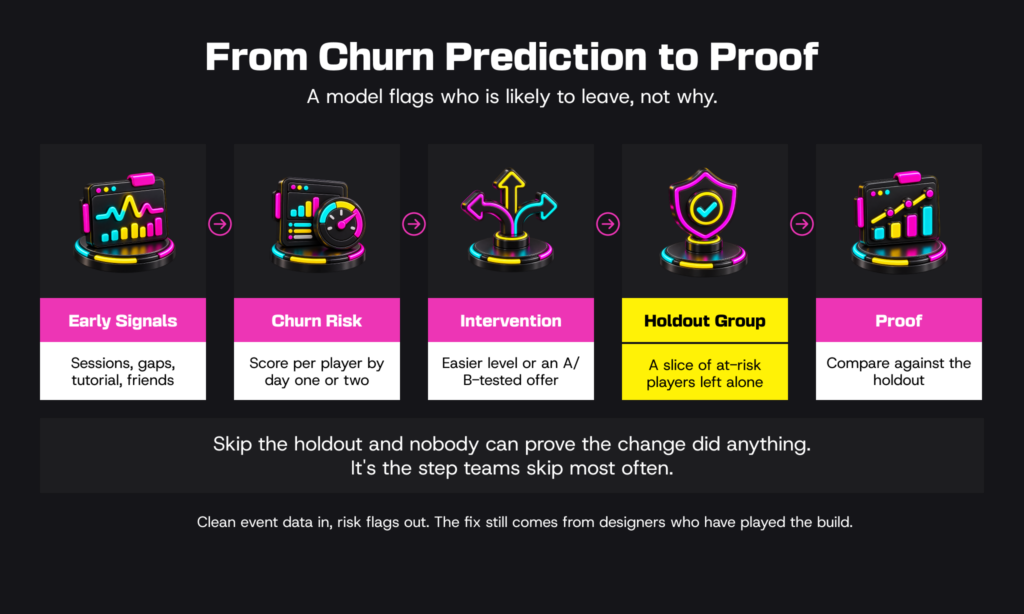
Where it gets interesting is what the game does with the prediction. A model flags someone as likely to quit on day two. Fine, now what? Some teams send that player to an easier level, others A/B test a different first offer, and the careful ones leave a slice of those players alone as a holdout group, because without that slice nobody can prove the change did anything. (It’s the step everyone skips, and the one we nag clients about most.) Automated cohort analysis is less glamorous and probably more useful. It’s the system that pings you on Wednesday to say Tuesday’s build lost four points on Android in Brazil, instead of letting a monthly review break the news three weeks late.
AI-assisted playtesting also gets there before real players do, at least for the first-time user experience. A bot will happily play a tutorial thousands of times, find the step where it gets stuck and turn up a soft lock no human tester had the patience to reproduce. Tireless, tasteless, and for a tutorial that’s exactly the brief. Adjust’s report cites a 2025 Google Cloud survey where more than 90% of game developers said they use AI for things like playtesting, localization and balancing.
The limits are real, and most of them come down to inputs. A churn model can only learn from what the game records. Most games we audit don’t log enough of the first session to tell a tutorial quit from a crash. And a model tells you who’s likely to leave, not why. Somebody still has to play the build, notice that level three is a wall, and decide what to change. Let the models point. Leave the fixing to designers who’ve actually played the game.
How Innovecs Games Helps Studios Build Games Players Return To
Innovecs Games has delivered 300+ games over more than a decade, with 200+ developers and artists working for studios and publishers in the US, UK, EU, Israel and Australia. A lot of that work lands on the drop-off points above. UI/UX and game designers handle the first session and onboarding. Engineering and QA deal with device-tier performance, load times and crashes, the quiet killers of day one. Designers and LiveOps teams look after the loop and the content that carry players through day seven and day thirty.
How we join depends on the gap. Our game co-development services put specialists inside your team and pipeline for a retention push; for new titles there’s full-cycle development, concept to live operation. One honest limit, though. No amount of polish saves a concept players don’t want, and sometimes the most useful thing a retention review can say is stop. The studios and games we’ve worked with are in our portfolio.
FAQ
What are good mobile game retention benchmarks in 2026?
Going by GameAnalytics’ 16,262 live games in 2025, the median sits at about 22% on day one, just under 4% on day seven and below 1% on day thirty, while the top quarter gets to just above 30%, 6% to 7% and 1.6% to 1.8%. Games with a marketing budget usually do better, and Adjust’s tracked apps averaged 27% on day one. Whether that makes your number good depends on genre and platform. Check those first, then celebrate or panic.
What is D1, D7, and D30 retention?
It’s the share of an install cohort that opens the game again on exactly day one, day seven or day thirty after installing. Say 1,000 people install on Monday and 250 of them play on Tuesday: that’s a D1 of 25%, and the 1,000 stays the denominator for every later day too. One warning, though. Some sources quietly use rolling retention, or day 28, so read the small print before you compare.
How many installs do you need for reliable retention data?
More than most soft-launch budgets assume, especially for the later days. Take 1,000 installs: a 25% D1 reading is accurate to roughly ±2.7 points, which is fine, but a 1% D30 reading on the same cohort can be off by more than half its own value, which isn’t. Pinning D30 at 1% to within ±0.2 points takes a sample size of about 9,500 installs per cohort, and every split by platform, country or channel needs its own. GameAnalytics doesn’t count games under 1,000 monthly active users at all.
Which game genres have the best retention?
Among category leaders, mid-core: Sensor Tower’s top 25 mid-core games sit at about 42% on day one and 11% on day thirty. For medium and long-term retention, GameAnalytics’ 2025 edition pointed to board, card, puzzle and casino. Hypercasual and hybrid-casual had the highest day-one rate in Adjust’s 2025 data (27%) but fade faster. Action and arcade, at 19% and 20%, trailed Adjust’s 27% average by a fair margin.
Do iOS players stay longer than Android players?
Usually. The best iOS games in GameAnalytics’ 2025 edition held 31% to 33% of players on day one; on Android the same top quarter held 25% to 27%. Later in the month the gap may get wider, if one US study of board games is anything to go by (8.13% versus 5.09% on day thirty, per AppsFlyer). Android players do open games more often each day, though, so treat the two stores as separate markets and benchmark them apart.
What D1 rate should a game hit in soft launch?
Depends who you ask, and nobody’s written it down officially. Our starting point is the platform’s top quartile. On the 2024 numbers that’s 31% to 33% for iOS and 25% to 27% for Android, or about 30% if you mix them, and genre pushes it around a lot (near 40% for hybrid-casual and mid-core leaders, about 20% for the average action or arcade game). We’d also care about whether D1 climbs build after build as much as where it sits today.
Do paid and organic players retain differently?
The public data is old, and the two studies we know of disagree. AppsFlyer said in 2017 that organic installs were 60% more likely to stick; Adjust said in 2018 the difference in games was close to zero. What’s definitely changed is how much gets bought. Adjust counted 3.33 paid game installs per organic one in 2025, up 61%, so a blended curve is mostly a paid curve now, and on iOS you can’t always split the two cleanly.
What is a good D30 retention rate?
Somewhere around 1.6% to 1.8% puts a game in the top quarter of all live titles in GameAnalytics’ 2025 data, and 4% or more gets it into the top tenth in North America or Europe. Marketed games often do better (Adjust’s tracked gaming apps averaged 5%), and mid-core leaders reach about 11%. For a marketed game, our genre table treats 2% to 4% as healthy in most genres, a bit higher for mid-core and board. The old 10% rule now describes roughly the top 1%.
🤖 How is AI used to predict player churn?
Mostly by watching the first few sessions. A model notes things like how often someone plays, how long they stay away, how far they got through the tutorial and whether they’ve added any friends, then puts a number on their odds of quitting. With Jelly Splash that took about a week of data to get right; in a 2022 study of a head-to-head mobile game, day one was enough. What it can’t tell you is why, and that part is still the designer’s job.
🤖 Can AI tools help a game keep more players in the first week?
Indirectly, yes. We like bots for tutorials: they’ll play the same five minutes thousands of times and show you exactly where people get stuck. Churn models can steer at-risk players toward an easier path, and automated cohort tracking catches a bad build within a day or two. None of it saves a thin core loop, which is still the usual reason people are gone by day seven.
Ready to Build a Mobile Game Players Keep Coming Back To? Let’s Talk
Mobile game retention benchmarks tell you where a game stands, not how to move it. Moving it is our day job, from the first session to the core loop to the content that stops day thirty looking like day seven’s leftovers. Start with a call about your curve and your next build.